How to Use Support and Resistance in Technical Analysis
upport and resistance are core concepts in technical analysis. Whether you’re a beginner or experienced trader, understanding how to identify and use these levels can significantly improve your timing, reduce risk, and enhance trade accuracy.
In this guide, you’ll learn what support and resistance are, how to find them on a chart, and how to use them to make better trading decisions.
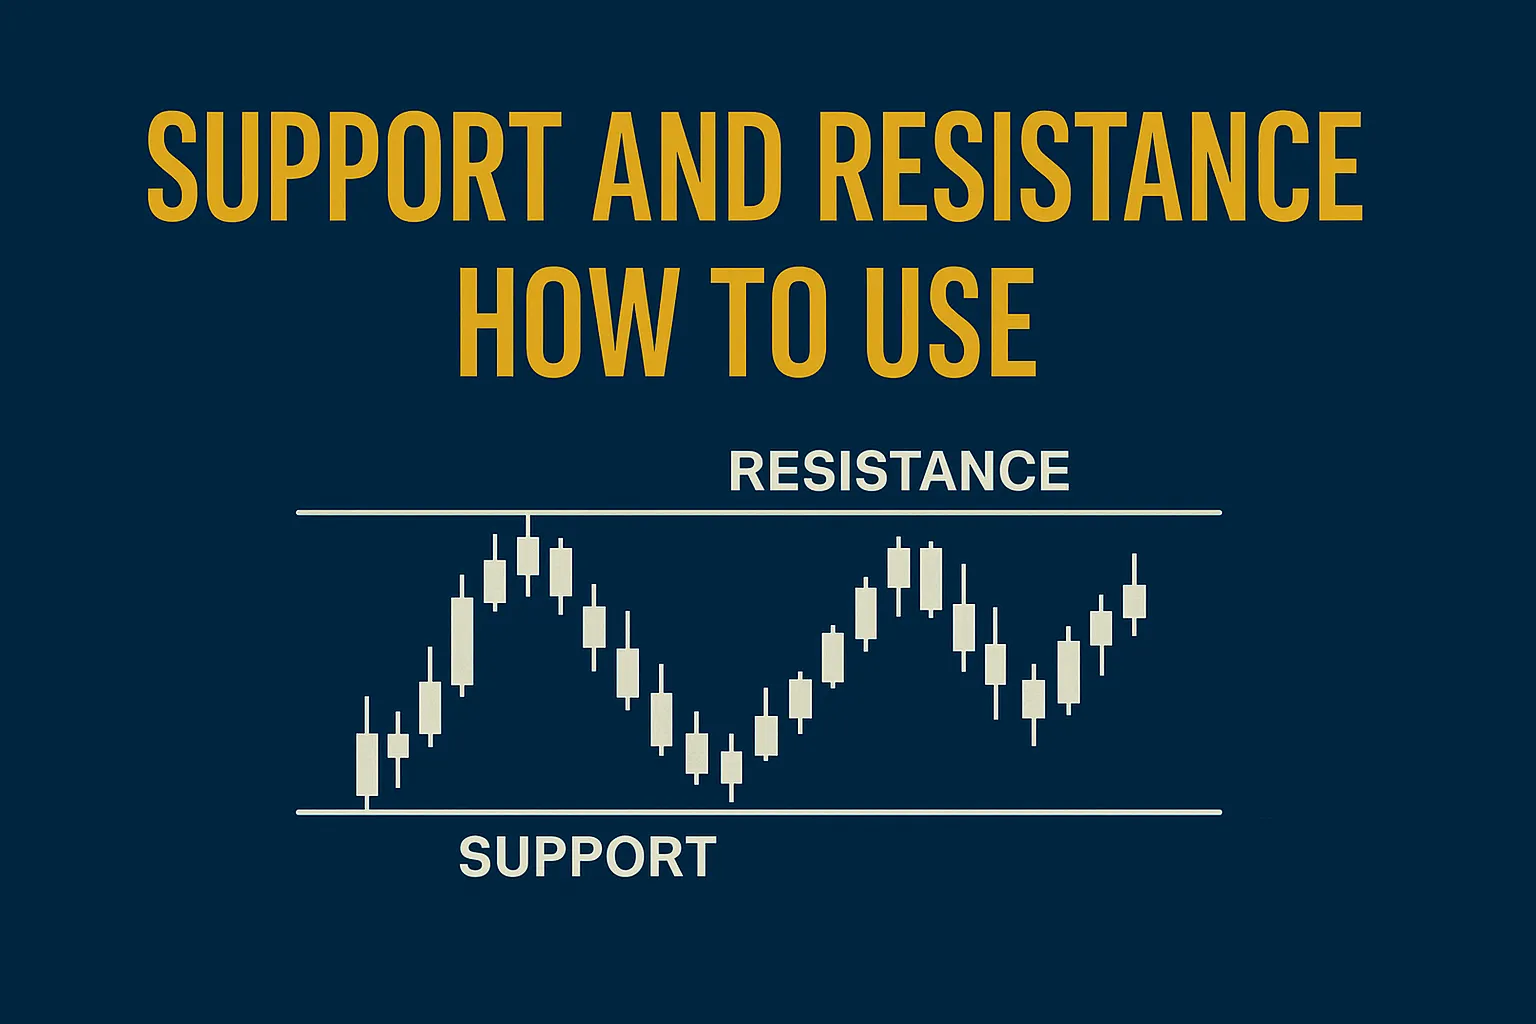
What Are Support and Resistance?
- Support is a price level where demand is strong enough to prevent the price from falling further. It acts as a floor.
- Resistance is a price level where selling pressure prevents the price from rising further. It acts as a ceiling.
Prices tend to bounce off these levels—until they break, and the roles reverse.
Why Support and Resistance Matter
- Help identify entry and exit points
- Set stop-loss and take-profit zones
- Confirm breakout or reversal opportunities
- Work across all timeframes and asset classes
How to Identify Support and Resistance
1. Horizontal Lines
- Look for areas where price has bounced multiple times.
- Connect 2 or more swing highs (resistance) or swing lows (support).
2. Psychological Levels
- Round numbers like 100, 500, 10,000 often act as support or resistance.
- Common in indices, stocks, and forex pairs.
3. Trendlines
- Draw diagonal lines connecting higher lows (support) or lower highs (resistance).
- Useful in trending markets.
4. Moving Averages
- 50-day and 200-day moving averages often act as dynamic support or resistance zones.
5. Fibonacci Levels
- Fibonacci retracement tools help identify key S&R zones like 38.2%, 50%, and 61.8%.
How to Use Support and Resistance in Trading
1. Bounce Strategy
- Buy at support, sell at resistance.
- Add confirmation from candlestick patterns (e.g., hammer, engulfing).
2. Breakout Strategy
- When price breaks above resistance, it often rallies.
- When it breaks below support, it may fall further.
- Confirm with volume spike or retest of the level.
3. Role Reversal
- Once a resistance level is broken, it can act as support (and vice versa).
- This is known as a “flip zone.”
Example Scenario
- Stock XYZ bounces off ₹800 support three times.
- Price approaches ₹850 resistance, then breaks out on high volume.
- ₹850 now becomes new support.
- Next target could be ₹900 or ₹950 resistance zone.
Tips for Using Support and Resistance
- Combine with other tools like RSI, MACD, or volume for better signals.
- Don’t expect levels to be exact; treat them as zones, not lines.
- Always use stop-loss beyond the S&R level to avoid false breakouts.
Conclusion
Support and resistance are foundational elements of technical trading. When properly identified and combined with confirmation tools, they offer high-probability trade setups for both short- and long-term traders.
Practice spotting these levels on charts and test different strategies in a demo account to build confidence and accuracy.
FAQs
1. Do support and resistance levels work in all markets?
Yes. They are effective in stocks, forex, crypto, and commodities.
2. Can support or resistance be broken?
Yes. When broken with strong volume, they often signal trend continuation.
3. How many times should price touch a level to confirm it?
At least twice, but three or more touches give stronger confirmation.
4. Are support and resistance better on daily or intraday charts?
Both. Use higher timeframes for stronger levels; intraday for active trading.
5. What tools can help identify S&R levels automatically?
TradingView, Chartink, and MetaTrader indicators can assist in marking zones.