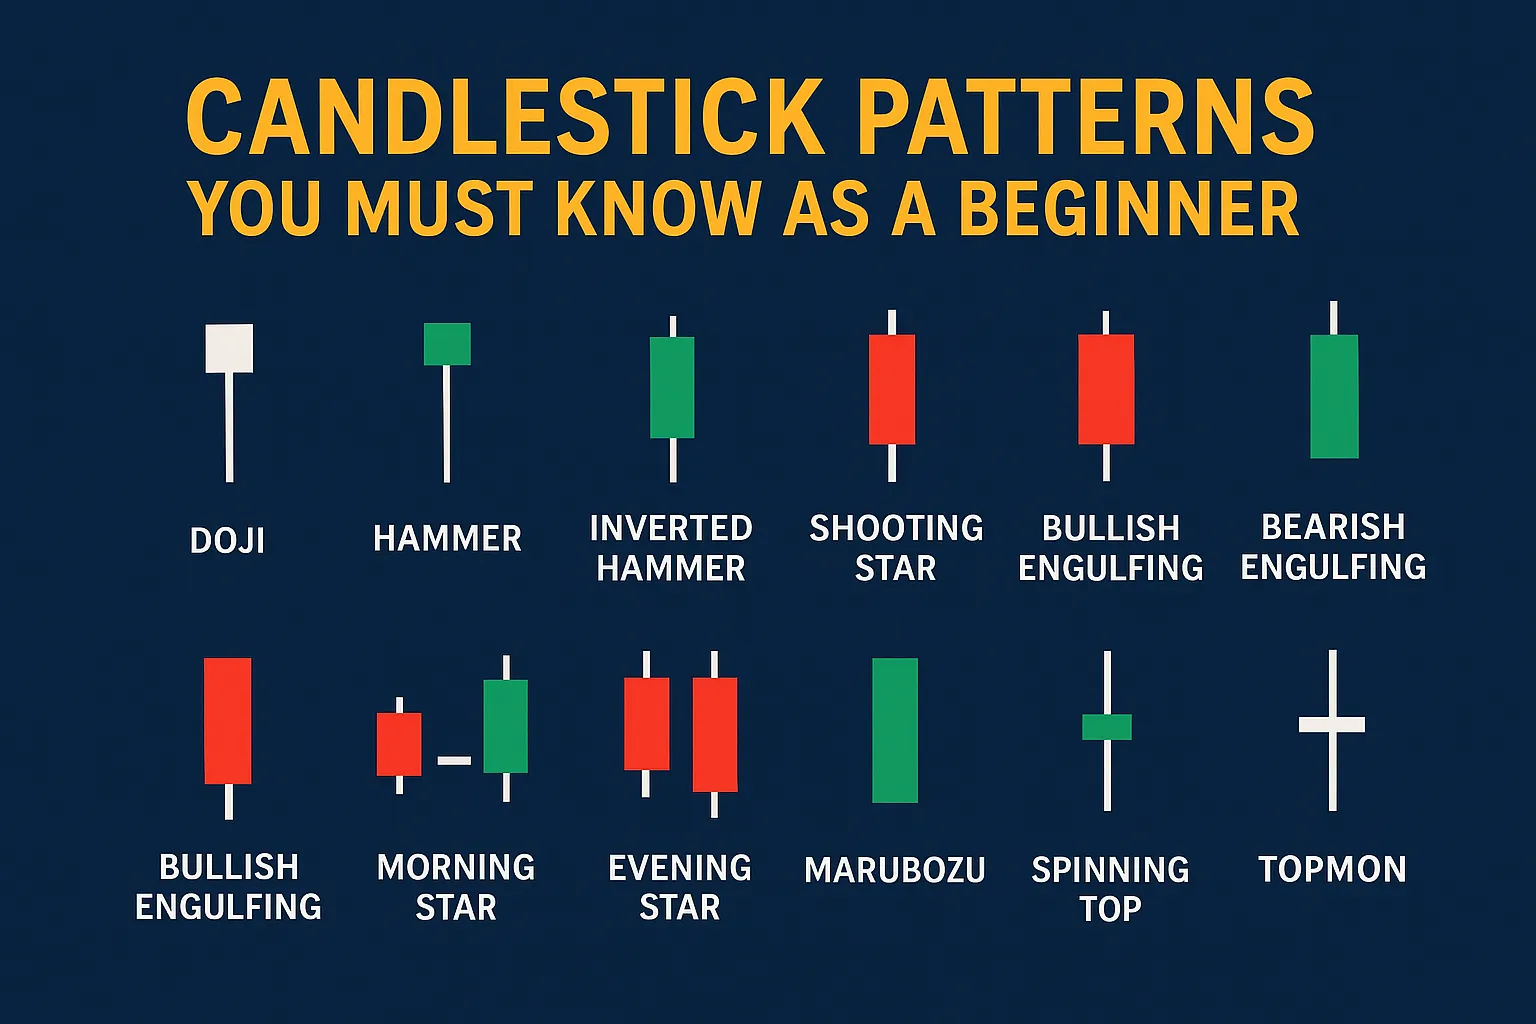
Candlestick Patterns You Must Know as a Beginner
Candlestick patterns are the language of price action. For beginners, learning to recognize these patterns can open the door to better market timing and more informed trades.
In this guide, you’ll learn the top candlestick patterns every beginner must know, how to spot them, and how to use them for trading decisions in 2025.
What Are Candlestick Patterns?
Candlestick patterns are formations created by one or more candlesticks on a price chart. Each candlestick represents the price movement within a specific time period—showing the open, high, low, and close (OHLC) prices.
These patterns help traders understand market psychology and predict future price movements.
Why Are Candlestick Patterns Important?
- Help identify potential reversals or continuation of trends
- Improve entry and exit timing
- Work across all markets—stocks, forex, crypto
- Useful for all timeframes (from 1-minute to monthly charts)
1. Doji
- Shape: Small body, open ≈ close, long wicks
- Meaning: Indecision in the market
- Use: Watch for confirmation in the next candle to determine direction
2. Hammer
- Shape: Small body on top, long lower wick
- Meaning: Bullish reversal after a downtrend
- Tip: Stronger when supported by volume and found at support zones
3. Inverted Hammer
- Shape: Small body at bottom, long upper wick
- Meaning: Bullish signal in a downtrend
- Note: Needs confirmation from the next bullish candle
4. Shooting Star
- Shape: Small body at bottom, long upper wick
- Meaning: Bearish reversal after an uptrend
- Use: Indicates selling pressure at the top
5. Bullish Engulfing
- Structure: A small red candle followed by a large green candle that fully engulfs the previous one
- Meaning: Strong bullish reversal
- Where it works: At the bottom of a downtrend
6. Bearish Engulfing
- Structure: A small green candle followed by a large red candle that engulfs the previous one
- Meaning: Strong bearish reversal
- Where it works: At the top of an uptrend
7. Morning Star
- Structure: Three candles (bearish → small indecision → bullish)
- Meaning: Bullish reversal
- Best used when: Found near support or oversold conditions
8. Evening Star
- Structure: Three candles (bullish → small indecision → bearish)
- Meaning: Bearish reversal
- Use: Strong signal if found at resistance
9. Marubozu
- Shape: Full-body candle with little/no wicks
- Meaning: Strong momentum in the direction of the candle
- Use: Bullish Marubozu = strong buyers; Bearish = strong sellers
10. Spinning Top
- Shape: Small body with long upper and lower wicks
- Meaning: Market indecision
- Tip: Wait for confirmation before acting on this signal
Bonus: Combine Patterns with Context
Candlestick patterns are more effective when combined with:
- Support and resistance zones
- Volume spikes
- Trendlines and indicators (e.g., RSI, MACD)
Conclusion
Understanding these candlestick patterns gives beginners a solid foundation in reading charts and predicting market behavior. While no pattern is perfect, combining them with context and confirmation can greatly improve your trading accuracy.
Start by observing these patterns in live charts and practice with paper trading before using real capital.
FAQs
1. Can candlestick patterns predict price movements?
They don’t predict—they help identify probable outcomes based on past behavior.
2. Are these patterns reliable?
They’re more reliable with confirmation, volume, and support/resistance levels.
3. Do these patterns work in intraday trading?
Yes, candlestick patterns are widely used in intraday as well as swing and positional trading.
4. What is the most accurate candlestick pattern?
Bullish/Bearish Engulfing and Morning/Evening Star are considered among the most reliable.
5. Where can I practice reading candlestick patterns?
Use charting platforms like TradingView, Investing.com, or Yahoo Finance with real-time data.