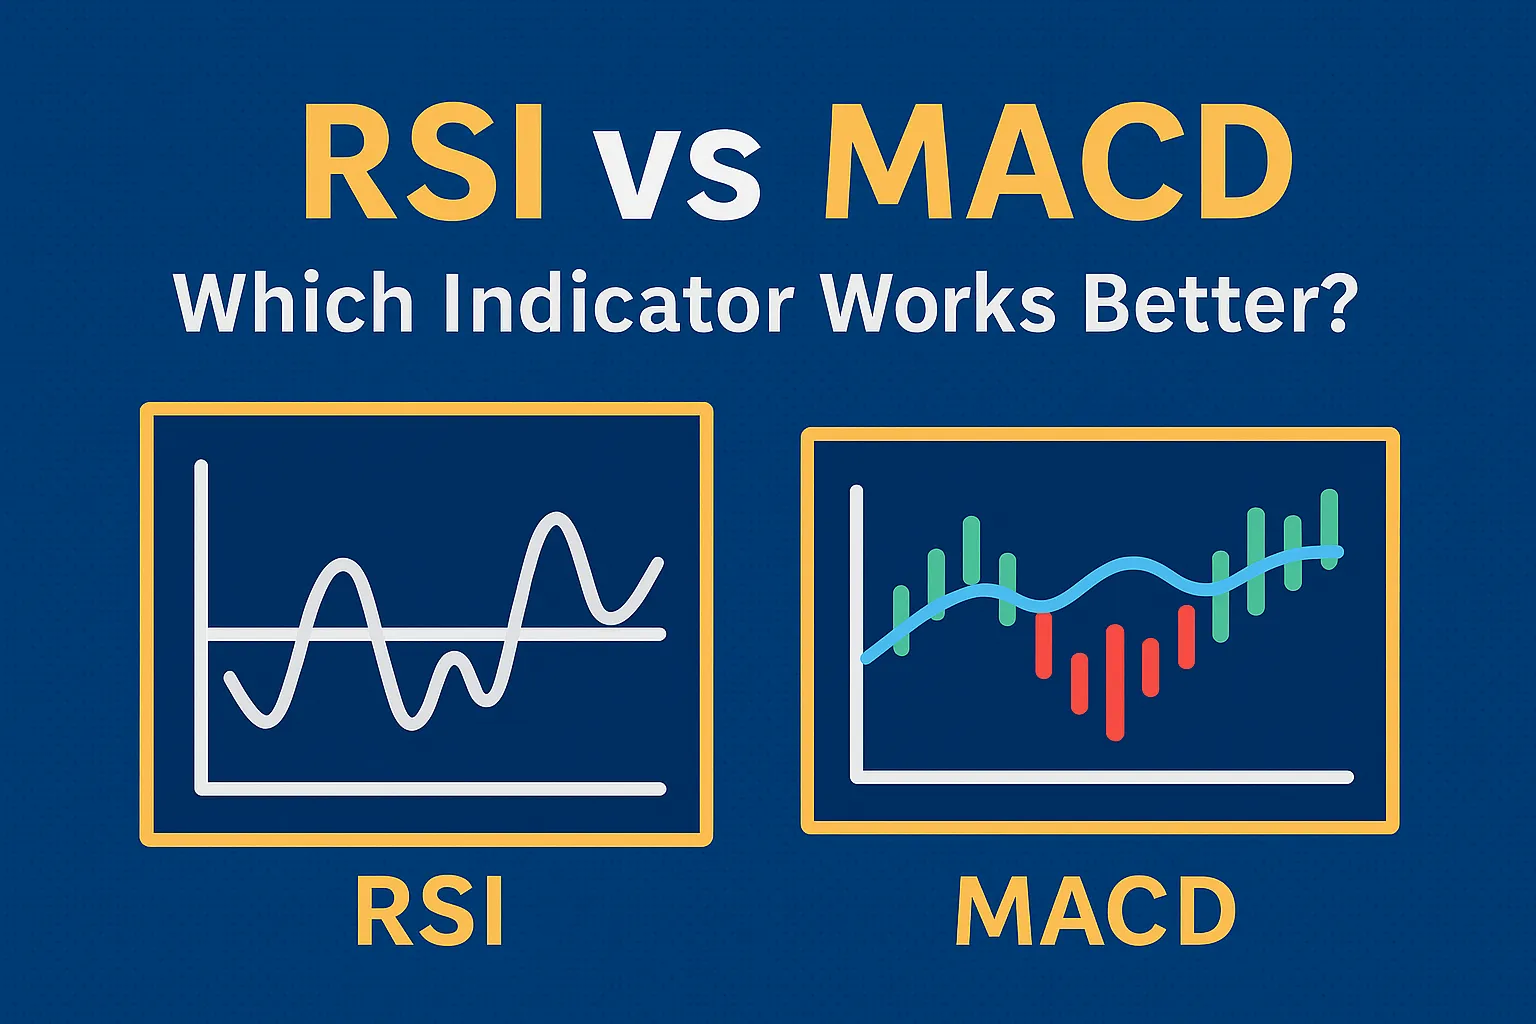
RSI vs MACD: Which Indicator Works Better?
When it comes to technical analysis, two indicators consistently top the list: Relative Strength Index (RSI) and Moving Average Convergence Divergence (MACD). Both are powerful tools for identifying momentum, trend strength, and potential reversal signals. But which one works better?
In this guide, we compare RSI vs MACD side-by-side so you can decide which suits your trading strategy best—or whether using both together is even better.
What Is RSI?
Relative Strength Index (RSI) is a momentum oscillator that measures the speed and change of price movements. It ranges from 0 to 100.
- Above 70 = Overbought
- Below 30 = Oversold
- Default Setting: 14 periods
Best For:
- Spotting reversals
- Identifying overbought/oversold conditions
- Quick momentum signals
What Is MACD?
Moving Average Convergence Divergence (MACD) is a trend-following momentum indicator based on the relationship between two EMAs.
- MACD Line: 12 EMA – 26 EMA
- Signal Line: 9 EMA of MACD
- Histogram: Difference between MACD line and Signal line
Best For:
- Spotting trend changes
- Momentum direction and strength
- Crossover-based signals
Key Differences: RSI vs MACD
| Feature | RSI | MACD |
|---|---|---|
| Type | Oscillator | Trend + Momentum Indicator |
| Range | 0–100 | No fixed range |
| Use | Overbought/oversold | Crossovers, divergences |
| Reactivity | Faster | Slower but smoother |
| Best For | Short-term momentum | Trend confirmation |
When to Use RSI
✅ Pros:
- Simple to read and interpret
- Great for spotting reversals at extreme levels
- Quick signals during consolidation
❌ Cons:
- Prone to false signals in trending markets
- May stay overbought/oversold for extended periods
Best suited for: Range-bound markets, swing trading, and entry timing.
When to Use MACD
✅ Pros:
- Strong at identifying trend direction
- Great for spotting crossovers and divergences
- Works well in trending markets
❌ Cons:
- Lags in fast-moving markets
- Fewer signals compared to RSI
Best suited for: Trend-following strategies and confirmation of reversals.
Can You Use RSI and MACD Together?
Yes. In fact, combining RSI and MACD is a common and effective strategy.
Example Strategy:
- Buy Setup: MACD crossover (bullish) + RSI rising from oversold (<30 to >30)
- Sell Setup: MACD crossover (bearish) + RSI falling from overbought (>70 to <70)
Using both helps filter out false signals and increase confidence in trade entries and exits.
Example Comparison Scenario
Let’s say a stock is in a mild uptrend.
- RSI = 75: Indicates overbought → potential pullback
- MACD = Bullish Crossover: Indicates momentum is still strong
Decision: Wait for MACD to flatten or RSI to fall before entering long. Or take profit if already in a position.
Conclusion: Which Works Better?
| If You Want… | Choose |
|---|---|
| Quick entry/exit signals | RSI |
| Trend confirmation | MACD |
| Best of both worlds | Combine RSI + MACD |
No single indicator is universally better. It depends on your trading style, market conditions, and timeframe.
For best results, practice using both in combination, backtest your strategy, and always apply proper risk management.
FAQs
1. Can I trade using only RSI or MACD?
Yes, but combining them improves accuracy and reduces false signals.
2. What’s the best timeframe for these indicators?
RSI: 15-min to daily; MACD: 1-hour to daily or weekly charts.
3. Do RSI and MACD work in crypto and forex?
Yes, both indicators are widely used across asset classes.
4. Which gives more signals—RSI or MACD?
RSI provides more frequent signals, while MACD is better for confirmation.
5. Are RSI and MACD suitable for beginners?
Absolutely. Both are beginner-friendly with practice and can be used in most charting platforms.