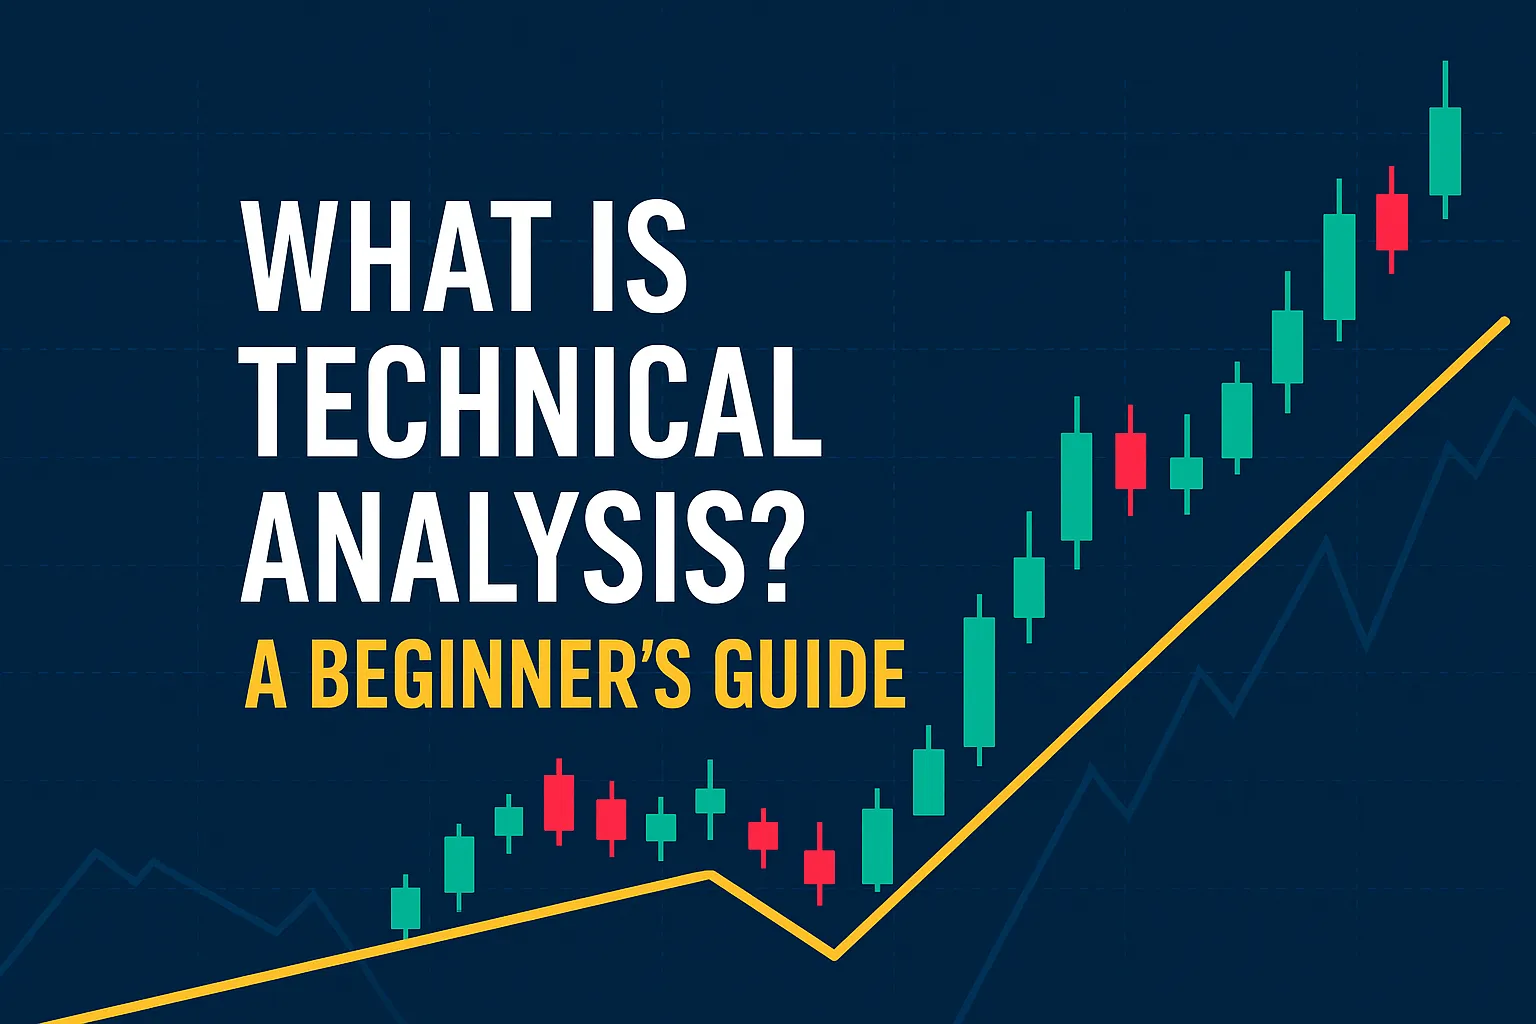
What is Technical Analysis? A Beginner’s Guide
Technical analysis is one of the most powerful tools in a trader’s arsenal. Whether you’re a beginner in stocks, crypto, or forex, understanding technical analysis (TA) can help you make smarter, faster trading decisions by studying price movements and market behavior.
This guide explains what technical analysis is, how it works, and how beginners can start using it with confidence.
What Is Technical Analysis?
Technical analysis is the study of historical price data—mainly price charts and volume—to forecast future market movements. It assumes that all relevant information is already reflected in the price and that patterns tend to repeat over time.
Why Use Technical Analysis?
- Identify trends early
- Spot buy and sell signals
- Determine entry and exit points
- Analyze short-term and long-term price action
- Works across stocks, forex, crypto, and commodities
Unlike fundamental analysis (which looks at financials), TA focuses purely on price behavior.
Core Principles of Technical Analysis
- Price Discounts Everything
All known fundamentals are reflected in the market price. - Price Moves in Trends
Prices move in trends, and traders aim to ride these trends. - History Tends to Repeat Itself
Human behavior in markets is predictable and repeats in patterns.
Key Tools Used in Technical Analysis
✅ Charts
The foundation of technical analysis. Common chart types include:
- Line Chart: Simple closing price view
- Bar Chart: Shows OHLC (Open, High, Low, Close)
- Candlestick Chart: Most popular; easy to visualize patterns and sentiment
✅ Indicators
Mathematical formulas based on price and volume data:
- Moving Averages: Trend direction
- RSI (Relative Strength Index): Overbought/oversold conditions
- MACD: Momentum and trend reversals
- Bollinger Bands: Volatility indicators
✅ Volume Analysis
Volume confirms price strength. A breakout with high volume is stronger than one with low volume.
Common Chart Patterns
| Pattern Name | Type | Meaning |
|---|---|---|
| Head & Shoulders | Reversal | Trend is ending |
| Double Top/Bottom | Reversal | Potential reversal |
| Triangles | Continuation or breakout | Pause before big move |
| Flags & Pennants | Continuation | Trend continuation setup |
Recognizing patterns helps you anticipate market behavior.
Timeframes in Technical Analysis
| Trader Type | Preferred Timeframe |
|---|---|
| Intraday Trader | 1-min to 15-min charts |
| Swing Trader | 1-hour to daily charts |
| Long-Term Investor | Daily to weekly charts |
Multiple timeframe analysis helps confirm trends across perspectives.
Limitations of Technical Analysis
- Not predictive, only probabilistic
- Less effective in news-driven markets
- Can produce false signals (especially in choppy markets)
That’s why many traders combine it with risk management and fundamental analysis.
Getting Started with Technical Analysis
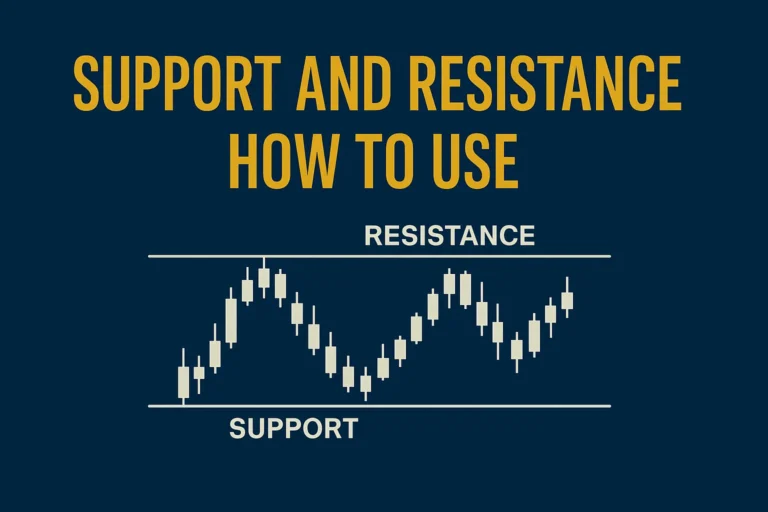
- Learn chart basics (candles, trends, support/resistance)
- Choose a charting tool (TradingView, Zerodha Kite, Chartink)
- Start with simple indicators (RSI, MA)
- Practice spotting patterns on real charts
- Use a demo account to test strategies before trading live
Conclusion
Technical analysis is an essential skill for anyone serious about trading. It allows you to read the market’s language—price action—and make educated decisions based on trends, momentum, and key levels. As a beginner, start with the basics, study charts daily, and build your skill step-by-step.
With time and practice, technical analysis becomes a natural part of your trading process.
FAQs
1. Is technical analysis better than fundamental analysis?
Not better—just different. TA is ideal for short-term traders; fundamentals suit long-term investors.
2. Can I trade using only technical analysis?
Yes. Many professional traders rely solely on technicals.
3. What’s the best platform to use for technical analysis?
TradingView is globally popular; in India, Zerodha Kite and Chartink are great too.
4. How long does it take to learn TA?
With consistent practice, you can grasp the basics in 1–2 months.
5. Are technical indicators always accurate?
No. They offer probabilities, not guarantees. Always use stop-loss and proper risk control.