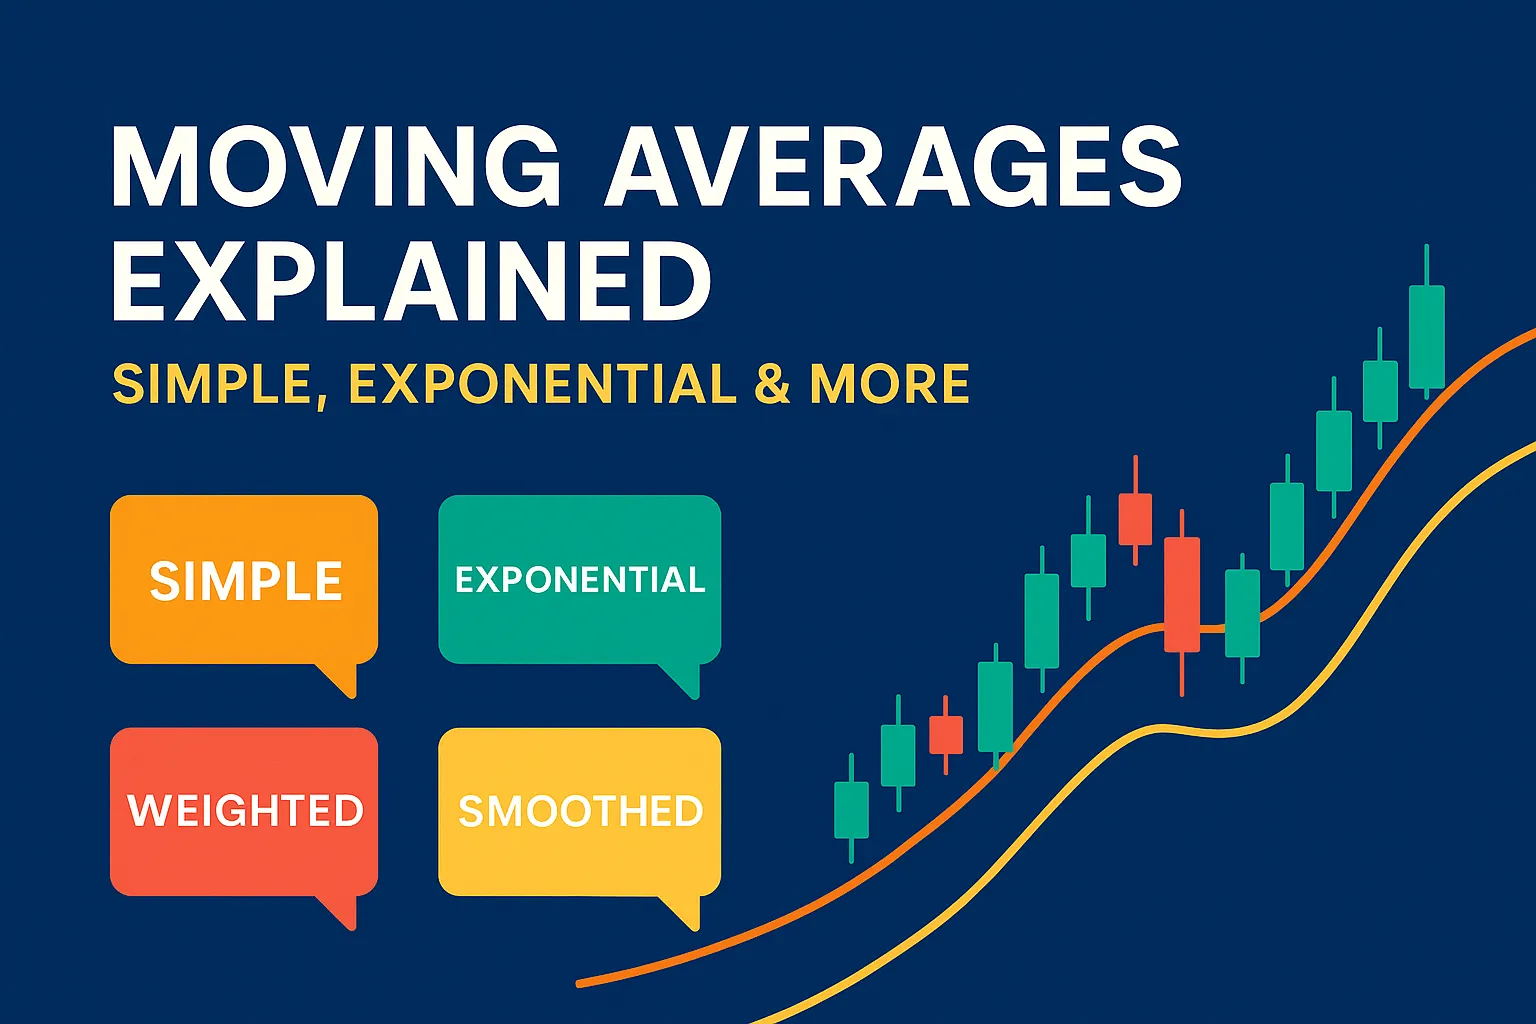
Moving Averages Explained: Simple, Exponential & More
Moving averages are one of the most widely used tools in technical analysis. They help traders and investors understand market trends, filter out noise, and identify support and resistance levels. This guide explains the different types of moving averages—including Simple (SMA), Exponential (EMA), Weighted, and others—along with how to use them effectively in your trading.
What Is a Moving Average?
A moving average (MA) is a line on a chart that shows the average price of an asset over a specific number of periods. As new data becomes available, the average “moves,” updating its value.
Why use them?
- Smooth out price fluctuations
- Identify trend direction
- Generate trading signals
- Act as dynamic support or resistance
1. Simple Moving Average (SMA)
Definition:
The average closing price over a set number of periods, giving equal weight to each.
Example:
A 10-day SMA adds the last 10 closing prices and divides by 10.
Best for:
- Identifying long-term trends
- Filtering market noise
Common settings:
50-day and 200-day SMAs are popular among swing and long-term traders.
2. Exponential Moving Average (EMA)
Definition:
Gives more weight to recent prices, making it more responsive to current market action.
Example:
The 10-EMA reacts faster than the 10-SMA when prices shift.
Best for:
- Short-term traders and scalpers
- Spotting quicker trend changes
Popular combos:
- 9 EMA + 21 EMA
- 12 EMA + 26 EMA (used in MACD)
3. Weighted Moving Average (WMA)
Definition:
Each data point is assigned a specific weight, with more recent data receiving more importance.
Best for:
- Traders who want even more emphasis on recent price data
- Advanced users building custom strategies
4. Smoothed Moving Average (SMMA)
Definition:
A variant of the SMA that includes older data to reduce sensitivity even further.
Use Case:
Helps with longer-term trend identification without reacting to short-term volatility.
Comparing MA Types
| Type | Reacts Quickly? | Easy to Understand | Best Use |
|---|---|---|---|
| SMA | ❌ No | ✅ Yes | Trend detection |
| EMA | ✅ Yes | ✅ Yes | Short-term trades |
| WMA | ✅ Faster | ❌ Less common | Custom weighting |
| SMMA | ❌ Slowest | ✅ Yes | Long-term smoothing |
How to Use Moving Averages in Trading
1. Trend Direction
- Price above MA = uptrend
- Price below MA = downtrend
2. Support and Resistance
- MAs act as dynamic levels
- Price often bounces off 50 or 200 MAs
3. Crossovers (Signals)
- Golden Cross: 50 SMA crosses above 200 SMA (bullish)
- Death Cross: 50 SMA crosses below 200 SMA (bearish)
- EMA crossovers are faster and more responsive for swing trades
4. Moving Average Envelope or Band
- Combine moving averages with standard deviation or percentages to create dynamic bands (e.g., Bollinger Bands)
Which Moving Average Should You Use?
| Goal | Best MA |
|---|---|
| Long-term investing | 50 or 200 SMA |
| Swing trading | 21 or 50 EMA |
| Day trading | 9 or 20 EMA |
| Reducing noise | SMMA or SMA |
| Fast entries | EMA or WMA |
Conclusion
Moving averages are simple yet powerful tools for identifying trends, timing trades, and managing risk. Whether you’re using a basic 50-day SMA or a fast-reacting EMA, understanding how each type works will give you a significant edge in your analysis.
Experiment with different combinations to find what suits your strategy and timeframe best.
FAQs
1. Which moving average is best for beginners?
The 50-day SMA is easy to use and offers a clear trend view.
2. Do moving averages work in sideways markets?
Not very well. They perform best in trending conditions.
3. Can I combine SMA and EMA in one strategy?
Yes. Many traders use SMA for trend and EMA for entries/exits.
4. Do moving averages repaint?
No. Moving averages do not repaint; they update with new data.
5. What’s the difference between MA and EMA?
EMA gives more weight to recent prices, while SMA treats all periods equally.